


If you’re looking to understand and create a graph for sieve analysis, you’ve come to the right place. This graph is a critical tool used to represent the particle size distribution of materials like soil or aggregates, crucial for determining their suitability in construction and engineering projects. In this article, we’ll guide you through the process of plotting this important graph, while providing you with a practical understanding of sieve analysis and its impact on material quality.
Key Takeaways from a Graph for Sieve Analysis
- A graph for sieve analysis is an essential process in determining the particle size distribution of materials, especially soil particles larger than 0.075 mm, which is crucial in various construction and engineering applications.
- Creating and interpreting a grain size distribution curve involves data preparation, plotting the percentage finer against the corresponding sieve size on semi-log graph paper, and discerning the soil’s grading and properties, which influence the material’s suitability for construction projects.
- Improving graph accuracy for sieve analysis is pivotal. Achieve it by selecting appropriate sieves, preparing samples properly, maintaining testing procedure consistency, and leveraging advanced techniques like custom Excel templates and macros for automation.
Understanding Graph for Sieve Analysis: Basics and Importance


A graph for sieve analysis is a simple yet ingenious concept. It involves placing a sample on a sieving surface with a specific aperture and separating the material by size. This process generates data recorded in a sieve analysis calculation table, showing the particle size distribution through a gradation curve. In soil grading, it uses a series of sieves with different mesh sizes to separate soil particles. Also, the cumulative percentage retained on various sieves provides a clear picture of the soil sample’s particle size distribution.
Sieve analysis is more than shaking materials and recording data. It plays a vital role in construction and engineering projects by offering insights into material quality and compliance with standards. By determining the grain size distribution, especially for particles larger than 0.075 mm, sieve analysis helps predict soil behavior in various applications.
The Graph for Sieve Analysis Process
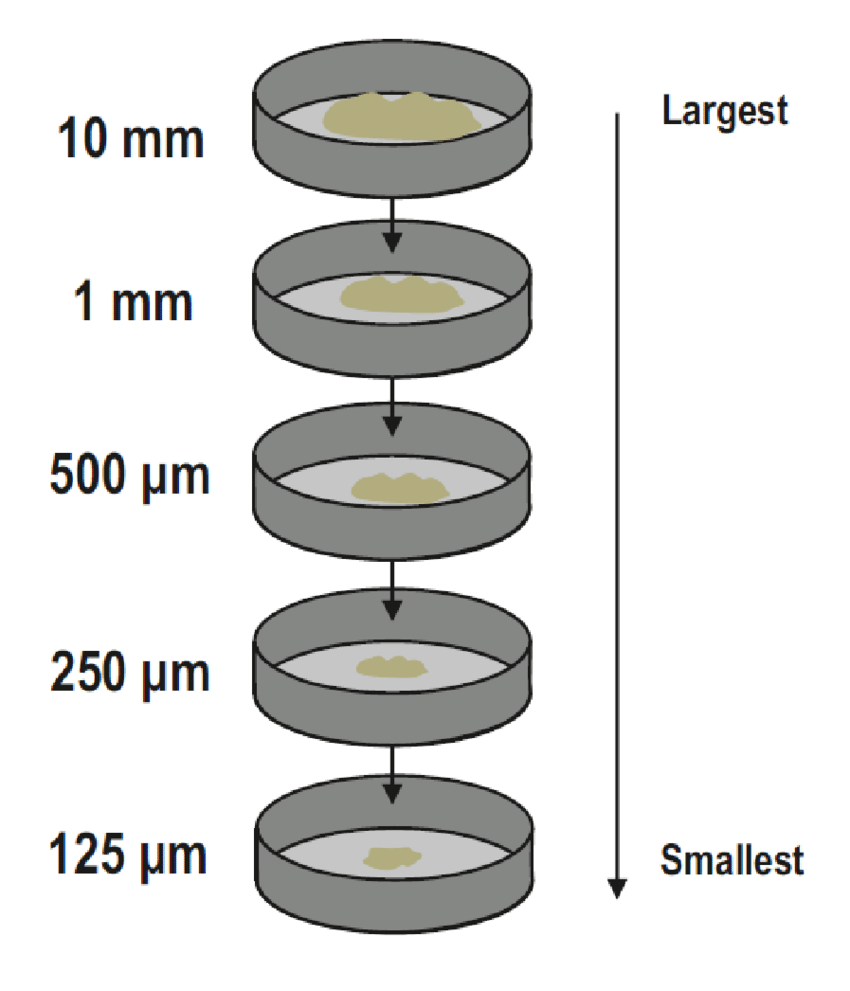
Despite appearing straightforward, the process of sieve analysis, also known as gradation analysis, encompasses intricate underlying procedures. Sieves with varying mesh sizes are used to segregate fine particles from coarse particles, dividing particles into specific sieve size categories. The separation of soil particles is accomplished by passing a sample of soil through a series of sieves with progressively smaller openings. This results in larger particles being retained on the top sieves, while smaller particles pass through to the lower sieves.
However, this method only forms a part of the whole narrative. The weight of the soil retained on each sieve also plays a crucial role in the analysis. In addition, it helps calculate the volume of each fraction and determine the mass-based distribution of the soil particles. We ascertain the particle size distribution by calculating the product of the quantity in each measurement class and the mean size measurement class. Then, we sum up the individual values to obtain the overall distribution.
Fascinating, isn’t it?
Importance of Accurate Graph for Sieve Analysis
At this point, you might be wondering how does all this sieving, weighing and calculating matter? Accurate sieve analysis, often referred to as a gradation test, has wide-ranging implications. By segregating soil particles according to their size, it provides valuable information about size distribution, assists in soil classification, and offers insights for engineering determinations.
If you’ve ever marveled at a towering skyscraper or driven on a smooth highway, you’ve witnessed the results of accurate sieve analysis. It plays a significant role in assessing the particle size distribution of materials, determining their suitability for a wide range of projects, and upholding quality standards in construction and engineering projects. However, inaccurate sieve analysis can lead to compromised concrete strength or inadequate soil compaction, which are detrimental to the integrity of any construction project.
Creating a Graph for Sieve Analysis: Step-by-Step Guide

Having understood the fundamentals and significance of sieve analysis, we can now proceed to elaborate on the process of creating a gradation chart for sieve analysis. In addition, the graph, often referred to as the grain size distribution curve, is a visual depiction of the proportion of each grain size present in a soil sample. It’s a useful tool that helps classify the soil and predict its characteristics.
Creating a graph for sieve analysis involves several steps: data preparation, plotting the grain size distribution curve, and interpreting the particle size distribution curve. Sounds complicated? Don’t worry. We’re here to guide you through each step. You’ll master the process of plotting a sieve analysis graph in no time!
Preparing Data for Graph of Sieve Analysis
Gradation data is needed to plot a graph. In sieve analysis, data preparation involves finding the quantity of material retained on each sieve. Divide the mass retained on each sieve by the total sample mass and multiply by 100 to get the percent retained.
Next, calculate the cumulative percentage retained by adding the percentage retained on each sieve and multiplying by 100. With this data, we can plot the grain size distribution curve.
Plotting the Grain Size Distribution Curve
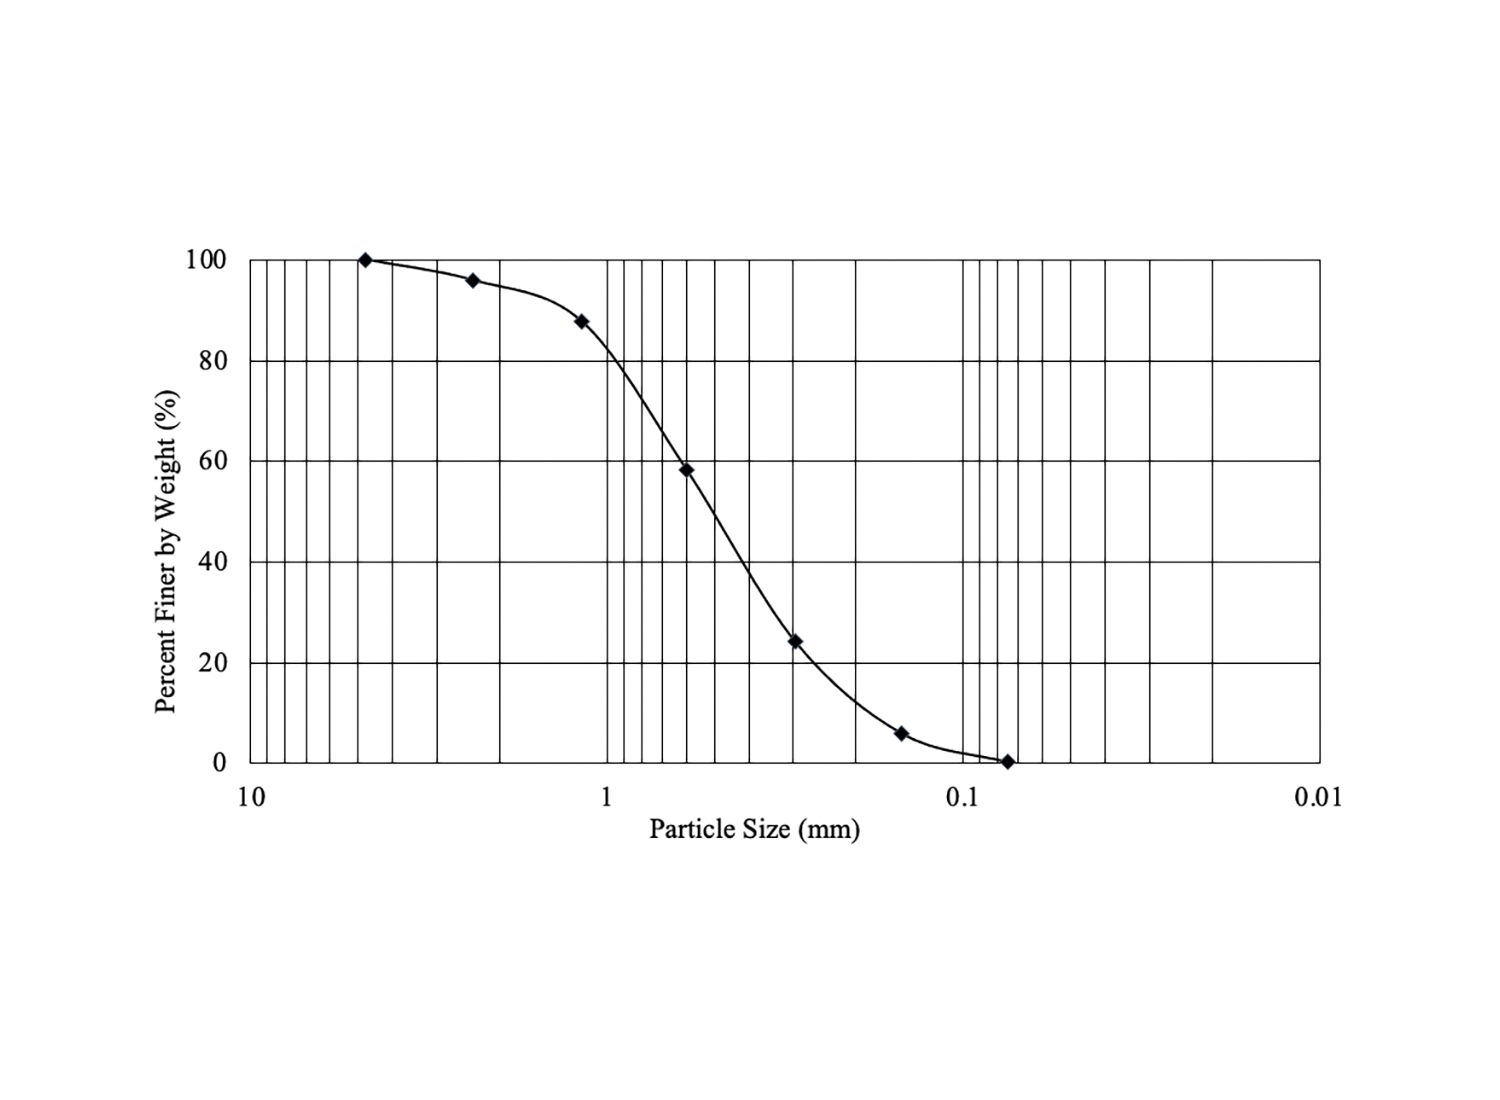
Plotting the grain size distribution curve, or gradation curve, shows the soil’s particle size and shape distribution. This curve in sieve analysis tells us how much material passes through or is retained on each sieve.
To create this curve, pass the soil sample through sieves with progressively smaller openings. Weigh the portion retained on each sieve. Plot the percentage finer against the corresponding sieve size on semi-log graph paper. Use a logarithmic scale for the particle size (x-axis) and a linear scale for the percent finer (y-axis).
Interpreting the Particle Size Distribution Curve
Creating the graph is one part, but interpreting it through gradation analysis is another challenge. The particle size distribution curve shows the average particle size, the minimum size, the range of particle sizes, and their distribution.
This curve helps determine the grading and proportion of different grain sizes, giving valuable insights into the material’s quality and properties. By interpreting this curve, engineers can assess if a material is suitable for construction projects.
Practical Tips for Improving Graph for Sieve Analysis Accuracy

Sieve analysis needs precision and accuracy for dependable results. This section shares practical tips to improve accuracy, including using a gradation test. Choose the right sieves and equipment, prepare the sample correctly, and maintain consistent testing procedures to ensure accurate soil grading.
The right tools and techniques are crucial in sieve analysis. The type of sieves and equipment can significantly affect result precision. Proper sample preparation prevents issues like blinding, which hinders particles from passing through the sieve stack. Consistent testing procedures guarantee reliable and comparable results.
Choosing the Right Sieves and Equipment
The selection of sieves and gradation equipment for your sieve analysis is a critical step. The size of the particles to be separated, the material to be sieved, and the stability of the sieve frame are all considerations that should be taken into account.
Sieves come in a spectrum of dimensions and varieties, ranging from 3 inches to 12 inches, with apertures varying from 5 inches (125 mm) to 635 mesh (20 microns). Furthermore, the temperature of the sieve material and the way the sample is handled can significantly impact the results of sieve analysis.
Maintaining and cleaning sieves properly is essential to ensure precise results obtained in sieve analysis.
Proper Sample Preparation
A well-prepared gradation sample is a cornerstone of accurate sieve analysis. The soil sample should be dried at 100°C before analysis to protect and enhance the ease of sample manipulation, sieving, and blending.
In addition to drying, other preparatory measures should be undertaken. This includes:
- Reducing the aggregate to a suitable size for testing
- Blending the aggregate to ensure the specimen represents the material being tested
- Evenly pouring the sample around the surface of the top sieve.
Consistency in Testing Procedures
Gradation consistency is key to achieving reliable results in the sieve analysis test. Here are some essential practices for maintaining consistency in sieve analysis testing procedures:
- Regular visual inspection of the sieves
- Ensuring proper sieving techniques
- Regular cleaning of the sieves
- Proper storage of the sieves
- Recertification of the sieves as necessary
By following these practices, you can ensure accurate and consistent results in your sieve analysis, taking into account the uniformity coefficient of the material being analyzed.
So, what are the prescribed testing procedures to be adhered to in sieve analysis? It encompasses the following steps:
- Weigh a sample of the material.
- Introduce the sample to the sieve stack.
- Agitate the stack for 5 minutes.
- Weigh the residue.
- Compute the percentage.
- Agitate for an additional minute.
Advanced Techniques for Graph for Sieve Analysis
Now that we understand the basics, let’s explore advanced gradation techniques for sieve analysis graphs. These techniques include using custom Excel templates and automating calculations with macros and formulas to streamline the process.
Choose XY (Scatter) as the chart type and select “scatter with data points connected with smoothed lines” as the chart subtype to generate a particle-size distribution plot in Excel. Excel templates can make the process easier by automating data input, particle size calculations, and graph generation.
Custom Excel Templates of Graph for Sieve Analysis
Custom Excel templates, including gradation templates, are real game-changers for sieve analysis. They include components such as the grain size distribution of the soil, the results of the sieve analysis test, and the percentage of particles in each size range.
By automating data input, particle size calculations, and graph generation, custom Excel templates offer several benefits:
- Save time
- Minimize the likelihood of errors in the analysis
- Effortlessly generate and distribute personalized analyses
- Eliminate redundant tasks
- Optimize efficiency
- Streamline processes
- Save time
Automating Calculations with Macros and Formulas
Macros and formulas are powerful tools in Excel that can automate calculations in sieve analysis through gradation automation. An Excel macro is a recorded action or set of actions that can be saved and executed multiple times. It enables the automation of repetitive tasks in Excel through the creation of a script of instructions.
Formulas frequently employed in sieve analysis calculations include determining the size range of particles present in soil as a percentage of the total dry weight and determining the grain size distribution of soils greater than 0.075 mm in diameter. Automation of these formulas using Excel functions can significantly enhance the efficiency of sieve analysis calculations.
Case Study: Real-World Graph for Sieve Analysis Application
While we have so far discussed sieve analysis in a theoretical context, its practical application is also crucial. Let’s dive into a gradation case study that explores sieve analysis graph application. This case study will provide insights into project background and objectives, sieve analysis results and graph interpretation, and lessons learned and best practices.
The background of a project, encompassing the materials used and the engineering objectives, shapes the application of sieve analysis. It guides the categorization, material choice, and analysis of engineering properties in geotechnical engineering projects.
Project Background and Objectives
The goals of a project greatly affect the requirements for particle size distribution and effective size. This influences the choice of sieves, equipment, and testing procedures.
For example, if you need to determine soil grain size or assess granular material particle size, you may need specialized sieve analysis methods. The particle size distribution and its impact on the project’s properties are key factors in choosing the right equipment.
Sieve Analysis Results and Graph Interpretation
Interpreting gradation results from sieve analysis and graphs gives crucial insights into the suitability of materials for construction projects. The sieve analysis graph shows the cumulative percentage of materials that remain on each sieve. This helps understand the properties and characteristics of the construction material related to grain size.
However, interpreting sieve analysis graphs can be complex. One must be mindful of potential errors such as:
- Overloaded sieves
- Inadequate sampling
- Poor sample division
- Insufficient use of sieves in the stack
These errors can lead to inaccurate findings.
Lessons Learned and Best Practices
By reflecting on the insights gained from the case study and past experiences, we can establish gradation best practices for subsequent sieve analysis. These include:
- Careful selection of appropriate sieve sizes
- Accurately dividing and loading samples
- Ensuring that the sieves are thoroughly cleaned before each analysis.
To uphold and measure the accuracy and effectiveness of sieve analysis, it is essential to:
- Conduct regular visual inspections
- Perform accurate sieving
- Ensure proper cleaning and storage of sieves
- Periodically recertify the sieves.
Summary
To sum up, in this journey through sieve analysis, we explored the basics, detailed the process, and learned how to create and interpret sieve analysis graphs. We also shared tips for improving accuracy, looked at advanced techniques, and applied our knowledge to a real-world case study.
Sieve analysis is more than just sifting. It’s a powerful tool that reveals the complex nature of soils, helping in construction and engineering projects. By understanding sieve analysis and mastering accurate soil grading, we can ensure project success and contribute to building strong and reliable structures.
Certified MTP has the largest selection of aggregate testing supplies, including Sieve Shaker Machines, test sieves, Classification Devices for Aggregate Testing, Sample Splitters and Dividers, and Specific Gravity Test Equipment.
Frequently Asked Questions
What is the use of a graph for sieve analysis?
The sieve analysis graph shows the particle size distribution curve. It depicts average, smallest, and largest particle sizes, and the material passing through or retained on each sieve. This graph clearly illustrates essential parameters, enabling precise analysis and interpretation in lab settings.
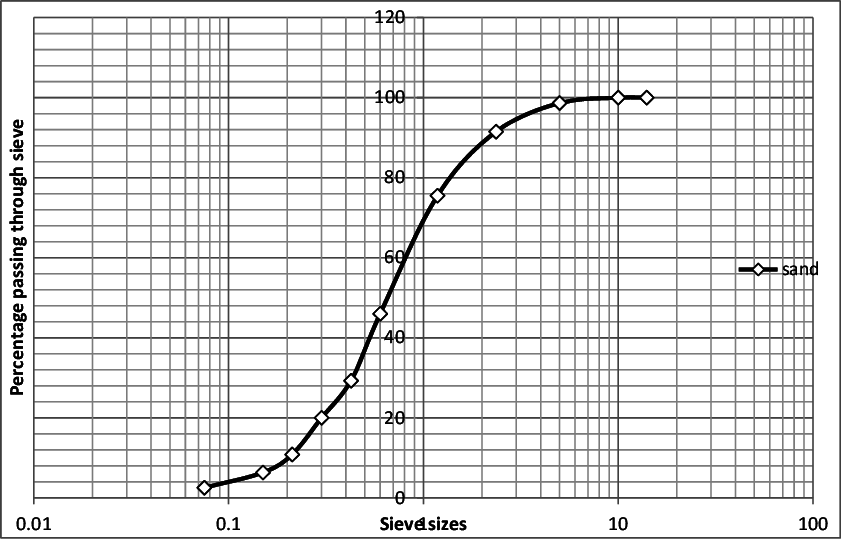
What is the S curve for graph for sieve analysis?
The S-curve for sieve analysis is a logarithmic graphical representation showing cumulative percent passing of grains of sand on the y-axis and the sieve size opening on the x-axis.
How do you analyze the graph for sieve analysis?
To analyze sieve results, calculate the percentage retained on each sieve. Then, determine the total percentage passing from each sieve. Divide the weight retained by the initial sample weight. Subtract the cumulative percentage retained from 100 to get the percentage passing each sieve.
How do you represent the particle size distribution in graph for sieve analysis?
The particle size distribution graphically represents as a curve dropping from 100% to 0%, denoting as 1-Q, indicating the percentage of the sample larger than a given size value.
What is the fundamental principle of sieve analysis?
The fundamental principle of sieve analysis involves separating a sample material based on its size using a sieving surface with a specific diameter and nominal aperture. This helps determine the particle size distribution of the material.
View the full line of Aggregate Testing Products and Aggregate Moisture Testing Equipment, especially the popular Aggregate/Sand Moisture Measurement System


