


At the heart of soil mechanics lies the Atterberg limit—a key indicator of soil consistency at various moisture contents, crucial for classifying and anticipating soil behavior. Understanding these metrics equips engineers and scientists with a predictive tool for designing stable foundations and infrastructures. This article outlines the determination of the Atterberg limit and its significant impact on the practical world of soil mechanics and engineering.
Key Takeaways
- Atterberg limits are critical indicators of a soil’s different states—solid, semi-solid, plastic, and liquid—and are essential for predicting the soil’s behavior, strength, and consistency based on its moisture content.
- The determination of Atterberg limits (liquid limit, plastic limit, and shrinkage limit) involves standardized tests such as the Casagrande cup method and rolling threads of soil and is integral for assessing soil properties like compressibility, permeability, and shear strength.
- Liquid limits have practical applications in engineering, informing soil classification systems, guiding foundation design, and helping to predict soil behavior in response to environmental conditions and stresses, which is invaluable in construction and civil engineering projects.
Deciphering the Limits

Liquid limits, namely the liquid limit, plastic limit, and shrinkage limit, act as precise indicators of the boundaries between solid, semi-solid, plastic, and liquid states of soil. Their values are ascertained based on the moisture content at certain points of physical change. Internationally recognized for soil identification and classification, they also correlate to the soil’s strength, which is invaluable in predicting soil behavior under different moisture conditions.
Gaining knowledge about the Atterberg limits essentially means deciphering the mysteries of soil behavior. These limits aren’t just random values; they determine the soil’s liquid state, define its workability and indicate its volume stability.
The Liquid Limit: Gateway to Soil’s Liquid State
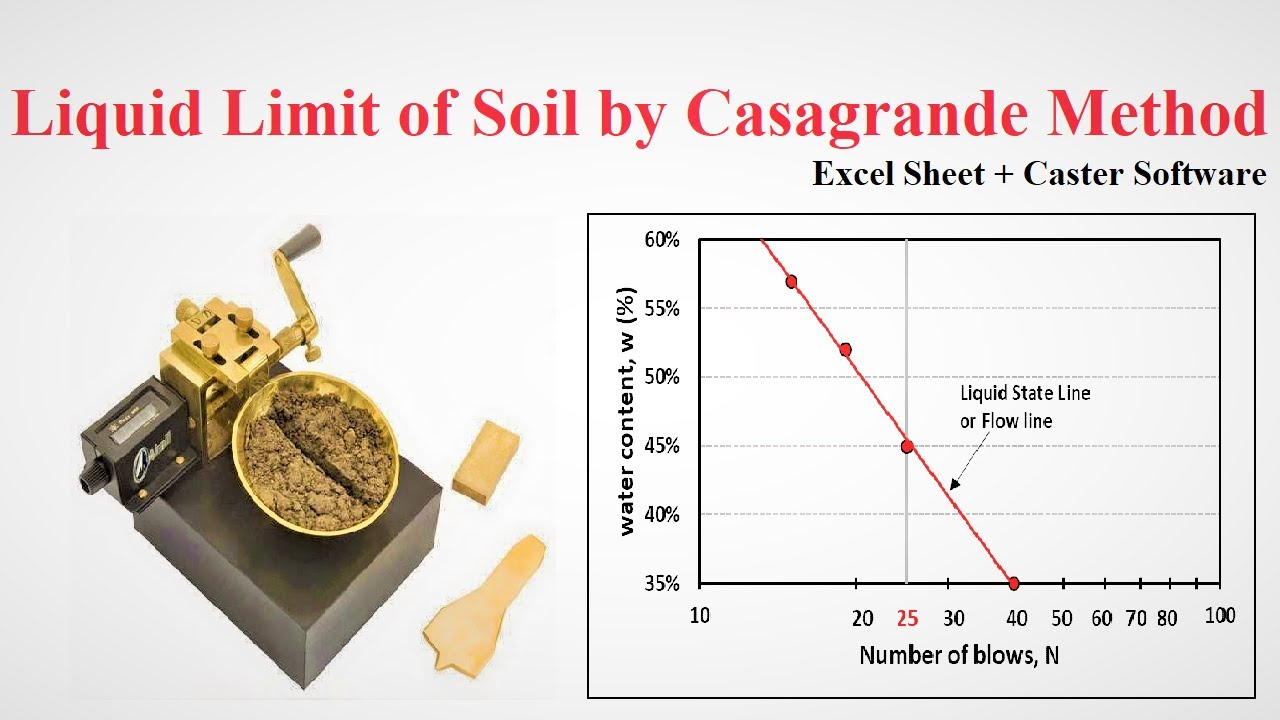
The liquid limit of soil is the water content at which soil loses enough strength to behave like a liquid, marking the transition where soil flows from a plastic to a liquid state. The Casagrande cup method or a cone penetrometer determines this transition. In the former method, a groove forms in a soil sample in the cup. The cup drops at a standard rate until the groove closes.
Using Casagrande’s device, engineers establish a basic measure of the water content at the transition point. They record the number of blows and plot a flow curve on semi-log graph paper.this method offers a precise and dependable measure of the soil’s liquid limit, a key factor in comprehending its liquid state.
Keep Reading: Exploring Atterberg Limits and Equipment Needed.
The Plastic Limit: Defining Soil’s Workability
The plastic limit of the soil, also known as plastic limit pl, is the minimum moisture content at which the soil retains its shape, marking the semi-solid to plastic state transition. The plastic limit test, standardized as per ASTM D4148, involves rolling the soil into threads on a flat surface until they crumble at a 3.2 mm diameter, signifying the plastic limit.
Operators typically perform the rolling process within a 2-minute timeframe, usually at a rate of 80-90 strokes per minute. They continue until the soil mass can no longer be shaped into a thread. Engineers quantify the moisture content at which soil behaves plastically according to ASTM Test Method D2216. They calculate the upper plastic limit as an average of trials, ensuring precision by repeating the test if there is significant variability.
The Shrinkage Limit: Soil Volume Stability Marker
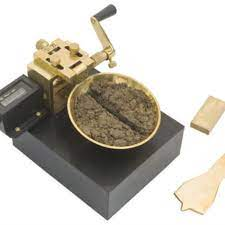
The shrinkage limit of soil is identified as the moisture content at which soil changes from a semi-solid to a solid state, indicating a limit of varying moisture contents beyond which additional moisture loss doesn’t decrease volume. The shrinkage limit test involves:
- Preparing a soil paste
- Carefully place it in a shrinkage dish in layers
- Air-drying it
- Oven-drying it to form a soil cake.
The calculation of the shrinkage limit incorporates variables such as:
- the weight of the water
- the volume of the wet and dry soil pats
- the specific gravity of water
- the weight of the oven-dry soil pat
Due to the toxic properties of mercury used in the shrinkage limit test, adherence to strict safety measures is imperative.
Additionally, the shrinkage limit can also be inferred using a correlation chart that ties together the liquid shrinkage limit sl, and plasticity index.
Soil Behavior and Limits

Atterberg limits serve as reliable predictors of soil compressibility, which is the tendency of soil to decrease in volume under load. The presence of clay minerals in the soil and their cohesive properties influence soil compressibility, with the change in compressibility of soil from solid to liquid state being marked by Atterberg limits.
These limits also inform the understanding of soil permeability by indicating soil consistency changes from more solid to more liquid states. Soil permeability is lower in the plastic state due to the alignment of clay particles, which is identified between the liquid and plastic Atterberg limits.
Furthermore, Atterberg limits facilitate the assessment of soil shear strength, crucial for structural stability, by representing soil consistency at various moisture contents. Empirical correlations exist between the Atterberg limits and soil’s shear strength, which are utilized for preliminary design stages in engineering.
From Solid to Liquid: Soil States and Transitions
Soil exists in four main states defined based on their water content: solid, semi-solid, plastic, and liquid. The transitions between these soil states are demarcated by Atterberg limits: the shrinkage limit for the solid to a semi-solid state, the plastic limit for the semi-solid to a plastic state, and the liquid limit for the plastic to a liquid state.
The soil’s moisture content is key since it directly impacts the transition between different states:
- Solid
- Semi-solid
- Plastic
- Liquid
Understanding these moisture-induced transitions is essential for predicting soil behavior under varying environmental conditions and for addressing soil mechanics challenges.
Interpreting Plasticity and Liquidity Indexes
The plasticity index (PI) and the liquidity index (LI) are vital instruments for interpreting Atterberg limits. The PI calculates the difference between the liquid limit and the plastic limit, indicating the range of water content over which the soil remains at the lower plastic limit.
Determine the LI by subtracting the plastic and liquid limit from the soil sample’s natural water content, then divide by the PI, scaling the soil’s natural moisture relative to its plastic and liquid limits.
High PI values indicate soil with more clay content, which relates to how well the soil can maintain its shear strength and volume stability under moisture changes. Interpreting these indexes helps predict other soil properties, and behavior, which aids in assessing suitability for construction projects, including firmness and consistency analysis.
Practical Applications of Limits in Engineering
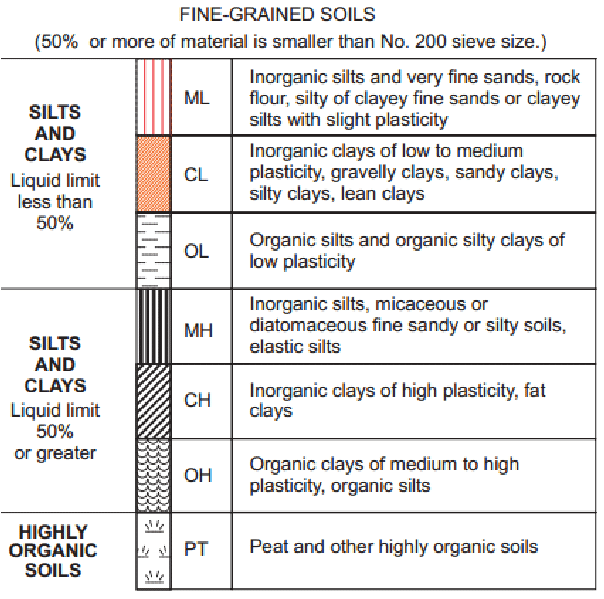

Practitioners practically apply Atterberg limits in soil classification systems like the Unified Soil Classification System (USCS) and the American Association of State Highway and Transportation Officials (AASHTO) system. These systems help in assessing soil compressibility and categorizing fine-grained soils, thereby guiding the foundation design for various structures. In essence, Atterberg limits directly influence decisions in civil engineering projects.
These limits aren’t just theoretical concepts; they’re practical tools engineers utilize to predict soil behavior in infills, embankments, and beneath pavements. In other words, Atterberg’s limits facilitate the translation of soil science into tangible, practical applications that shape our everyday lives.
Assessing Suitability for Construction
Soil classification based on Atterberg limits plays a crucial role in determining a soil’s suitability for various engineering purposes, such as foundation support or road construction. Non-plastic silty gravels and sands, for instance, can be classified into specific groups based on their Atterberg limits.
Also, for fine-grained, non-plastic silts, additional group symbols are suggested to classify these soils within the existing soil classification system. Nonplastic aggregates required for heavy or medium road base layers also have specific liquid limits and plasticity index values, as per Spanish law.
Predictive Tool for Soil Mechanics Challenges
Atterberg limits act as a forecasting tool for soil mechanics challenges. They are foundational in soil mechanics for predicting how soil will behave under varying moisture conditions, which is crucial for foreseeing issues related to soil settlement and structural integrity.
By utilizing the liquidity and consistency indices from Atterberg limits, engineers can evaluate the soil’s present state and its probable behavior in response to environmental factors and mechanical stress. For instance, integrating nano calcium carbonate into soils at the optimum amount of 0.4% enhances soil stabilization efforts, thereby affecting the soil’s plasticity index and bolstering its unconfined compressive strength.
Testing Procedures for Determining Limits

Establishing Atterberg limits requires particular standardized testing procedures and equipment. The ASTM D4318-00 is the standard reference for testing procedures used to determine the liquid limit, plastic limit, and plasticity index of soils. The standard test procedures and equipment used include:
- Balance
- Casagrande’s liquid limit device
- Grooving tool
- Mixing dishes
- Spatula
- Oven
- Plastic limit rolling device
Material passing through a No. 40 sieve is required for the preparation of soil samples for Atterberg limits tests. This process helps in determining the soil’s plastic and liquid limits. You can use the 40 (425μm) test sieve for both wet and dry methods as described in the standards. This provides flexibility for performing the required tests. We advise inexperienced operators or those testing soil types like organic or marine soils, which may affect accuracy, to use the multipoint method for the liquid limit test.
Preparing Soil Samples for Accurate Measurement
The precision of Atterberg limit testing largely hinges on the correct preparation of soil samples. Before conducting the tests, sieve soil samples to exclude particles larger than 425μm (No. 40 sieve). This ensures consistent sample size and enhances test accuracy.
Moreover, maintaining the soil’s natural moisture content is crucial for conducting accurate Atterberg limits tests. Drying the soil can alter the results by affecting the soil’s behavior in its natural state, thereby underscoring the importance of preserving the soil’s natural moisture content during testing.
Conducting the Liquid and Plastic Limits Tests
The liquid limit test determines the moisture content at which soil transitions from a plastic to a liquid state. This transition is measured using a Casagrande cup or a fall cone test, with the former method involving counting the number of blows needed to close a groove in the soil pat. The flow curve equation for the liquid limit test, which includes the water content and the number of blows, is instrumental in obtaining the liquid limit of the soil sample.
The plastic limit test, on the other hand, identifies the moisture content where the soil changes from a plastic to a semi-solid state. The same soil sample prepared for the liquid limit test is used to conduct the test and repeated the plastic limit test to maintain consistency in the testing material.
Correlation Between Limits and Soil Types
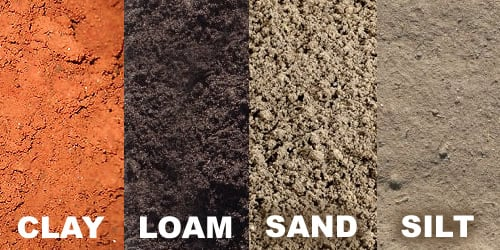

Atterberg limits have a significant part in differentiating between various soil types like silts and clays, a vital aspect of soil classification. Clay minerals in fine-grained soil allow it to be remolded with moisture without crumbling, as the water adsorbs around the clay soil particles.
Soils with a high plasticity index (PI) may expand under very wet conditions or shrink in dry conditions. This impacts their selection for construction. Additionally, soils with a high activity number, where the plasticity index to clay-size fraction ratio is over 1.25, are considered active. They will undergo increased volume changes in response to moisture conditions, posing potential challenges in soil mechanics.
Give special consideration to soils with high soluble salt concentrations, such as marine soils, as these salts can influence the liquid and plastic limit values.
Distinguishing Clayey Soil from Silty Soil
Clayey soils typically have higher Atterberg limits compared to clayey or silty soils, reflecting their greater plasticity and ability to retain water. The plasticity index, derived from the Atterberg limits, plays a crucial role in classifying soil as clay, silt, or non-plastic, and it influences suitability for different construction purposes.
The activity number of a soil sample, calculated by dividing the plasticity index by the clay-size fraction, provides valuable insights into the soil’s potential volume changes due to moisture variations. A soil activity number greater than 1.25 indicates its activity; commonly observed in clayey soils, they are more sensitive to moisture-induced volume changes compared to silty soils.
Non-Plastic Soils and Their Identification
Non-plastic soils, such as sands or gravel, do not possess the cohesive qualities that are typical of fine-grained soils. The Atterberg limits, which quantify the transition between solid, semi-solid, plastic, and liquid states, are inapplicable to non-plastic soils as they do not exhibit these properties.
Soils that are classified as having a plasticity index (PI) of 0 are indicative of non-plastic soils, typically lacking in silt and clay content. Understanding the characteristics of non-plastic soils and their classification based on Atterberg limits and plasticity index is crucial for their appropriate usage in construction and other engineering applications. Some key characteristics of non-plastic soils include:
- Low moisture retention
- Low compressibility
- High permeability
- Good drainage
By considering these characteristics, engineers can make informed decisions about the suitability of non-plastic soils for various construction projects.
Case Studies: Limits in Action
Atterberg limits are more than just theoretical constructs; they’re vital for establishing soil stability and have been applied in real-world scenarios and research. For instance, the soil studied was a very soft fluvial-marine gray clay, topped with a peat layer, serving as a real-world example for assessing Atterberg limits.
In this case, water content variation was significant, ranging from about 500% near the surface to 100% at depth. The depth of compressible soil reached up to 12 meters, highlighting the extent to which soil consistency impacted engineering considerations.
Infrastructure Projects Overcoming Soil Challenges
In numerous infrastructure projects, Atterberg limit tests have been instrumental in evaluating soil stability, guaranteeing their successful completion. Large-scale engineering feats such as dams, highways, and buildings have relied on the insights from Atterberg limit tests to handle soil challenges.
Atterberg limit assessments were critical in optimizing the choice of soil stabilization techniques in projects with problematic soils. For instance, the construction of a major dam was facilitated through Atterberg limit testing, which guided the adjustment of soil properties to meet project requirements. The application of Atterberg limit testing in these infrastructure projects has not only assisted during construction but also contributed to the longevity and durability of the structures.
Innovative Research Expanding Atterberg Limits’ Usefulness
Innovative research has broadened the applicability of Atterberg limits, especially in the field of soil improvement techniques. The addition of nanomaterials to soil can significantly influence its Atterberg limits, altering soil consistency and behavior. Some benefits of using nanomaterials for soil stabilization include:
- Improved soil properties without the need for additional chemicals
- Economically viable solution for soil stabilization
- Enhanced soil strength and stability
These advancements in nanotechnology offer promising opportunities for improving soil quality and performance in various applications.
Extended research is essential to assess the effectiveness of micro and nanosized additives on different soil types, and to further the advancement in nano-soil improvement techniques. Integrating tire rubber into clayey soil has demonstrated a reduction in the soil’s clay content and Atterberg limits, creating new opportunities for soil improvement and stabilization.
Summary
To conclude, Atterberg limits play an indispensable role in understanding and predicting soil behavior. Atterberg limits define the boundaries between solid, semi-solid, plastic, and liquid states of soil, directly influencing major engineering decisions. As we continue to build on this knowledge, it is clear that the principles established by Albert Atterberg will continue to shape our understanding of soil mechanics and guide our engineering practices for the foreseeable future.
Certified MTP has the largest selection of soil testing supplies, showcasing industry-leading brands for Hand auger tools and soil sampler equipment, Soil Moisture Testing Equipment, field density test equipment, Soil Penetrometers, Soil Strength Test Equipment, and Sand Cone Test Equipment.
Frequently Asked Questions
What do these liquid limits tell us?
These limits provide critical information about the water contents of fine-grained soils, indicating their transition from solid to liquid states. These limits offer valuable predictions for the engineering properties of silt and clay soils.
What is the liquid limit?
The liquid limit is the water content at which soil changes from a plastic to a liquid state when jarred in a specified manner, while the plastic limit is the water content at the change from a plastic to a semi-solid state.
What is the ASTM limit test?
The ASTM limit test is used to classify the properties of silt and clay soils at different moisture contents, aiding in the design of foundations and prediction of soil behavior in construction projects.
Why are limits important in engineering?
The limits are important in engineering because they predict how soil will behave under varying moisture conditions, aiding in foreseeing issues related to soil settlement and structural integrity.
How does soil type affect limits?
The type of soil directly affects its limits, with clayey soils usually having higher Atterberg limits than silty soils because of their greater plasticity and water retention.


