

From bridges and skyscrapers to tunnels and powerplants, we rely heavily on the stability and security of concrete. Compressive strength resilience plays an enormous role in ensuring the safety and sturdiness of our structures, but with so many different mixtures, how do we determine which concrete blend is suitable for the job? The answer, of course, is the concrete PSI chart.
Concrete PSI charts are a simple, effective way to assess the compressive strength of different types of concrete. They allow us to make informed decisions about concrete mix ratios, empowering us to create stronger, better concrete fit for its intended purpose.
In this article, we’ll detail how to read a concrete PSI chart, ways to use one, and how to assess the compressive strength of concrete. We’ll also show you where to find the best equipment for all your concrete testing applications.
What is a concrete PSI Chart?
A concrete PSI chart is a table indicating the resistance of different concrete mixes during a compressive strength test. This test evaluates how well concrete can handle compression when force is applied.
Concrete compressive strength is an essential way to determine the load-bearing capacity of a concrete mixture. An engineer can use this test to assess whether concrete is fit for its intended use.
The concrete PSI chart is an easy way to compare the PSI of different concrete types and select the right concrete mix ratio for a project. Let’s look at how you can interpret one.
Understanding the Concrete PSI Chart
To begin understanding the concrete PSI chart, let’s first examine an example of a standard concrete PSI chart.
|
Concrete Grade |
Concrete Mix Ratio (cement: sand : aggregate) |
Compressive strength (MPa (N/mm2)) |
Compressive strength |
|
M5 |
1 : 5: 10 |
5 MPa |
725 psi |
|
M7.5 |
1 : 4 : 8 |
7.5 MPa |
1087 psi |
|
M10 |
1 : 3 : 6 |
10 MPa |
1450 psi |
|
M15 |
1 : 2 : 4 |
15 MPa |
2175 psi |
|
M20 |
1: 1.5 : 3 |
20 MPa |
2900 psi |
|
M25 |
1 : 1 : 2 |
25 MPa |
3625 psi |
|
M30 |
Design Mix |
30 MPa |
4350 psi |
|
M35 |
Design Mix |
35 MPa |
5075 psi |
|
M40 |
Design Mix |
40 MPa |
5800 psi |
|
M45 |
Design Mix |
45 MPa |
6525 psi |
|
M50 |
Design Mix |
50 MPa |
7250 psi |
|
M55 |
Design Mix |
55 MPa |
7975 psi |
|
M60 |
Design Mix |
60 MPa |
8700 psi |
|
M65 |
Design Mix |
65 MPa |
9425 psi |
|
M70 |
Design Mix |
70 MPa |
10150 psi |
This table represents a more complex concrete PSI chart than you may typically use because it illustrates concrete’s ability to withstand pressure into both metric (MPa) and imperial (PSI) units.
That said, once you understand the fundamentals behind the concrete PSI chart, it is easily readable, reliable, and beneficial when determining the best mix ratio for your concrete projects. Let’s break it down.
Keep Reading: Concrete Curing Temperature Chart: Optimizing Strength.
Grades of Concrete and Mix Ratio
At the far left of the table, we can see the grades of concrete, denoted by ‘M’. The initial concrete grades, such as C10, C15, and C20, are used for various applications in both domestic and commercial settings. In this instance, M stands for ‘mix’, and the number next to the M represents the compressive strength in megapascals (MPa) of a molded concrete cube or concrete cylinder that has been cured for 28 days. The higher the ‘M’ grade, the more resistant the concrete is under compressive stress.
Both MPa and PSI measure the compressive strength of concrete. MPa is the metric version, whereas a Concrete PSI Chart, the measurement you’ll be most familiar with, is the imperial version used in the United States.
To the right of the concrete grade, you’ll notice the concrete mix ratio. This tells us the correct proportions of cement, sand, and aggregate (in that order) to create each concrete grade. For example, M5 concrete requires a ratio of 1:5:10. This means that 1 kg of cement, 5 kg of sand, and 10 kg of aggregates would make concrete with a compressive strength of 5 MPa.
Nominal Mix vs. Design Mix: What’s the Difference?
When reading the concrete PSI chart, you may notice that some grades are paired with a mix ratio while others are labeled design mix. Let’s explore what this means.
Nominal Mixes
Grades M5-M25 are labeled by a specific concrete mix ratio. For example, when creating M10 concrete, we know the mix proportions are one part cement, three parts sand, and six parts aggregates. We refer to these concrete grades as ‘nominal mixes’.
A nominal mix is based on a tried-and-tested approach from years of trial and error. It requires no scientific experimentation. Anyone of any skill level can create these mixes. As long as you follow the ratio instructions for your chosen M grade, you’ll create a low-mid strength concrete to a reasonable degree of accuracy.
That said, nominal mixes can be unreliable because they don’t consider factors such as material characteristics, curing time, and water content. For this reason, you’ll typically only use a nominal mix to create regular concrete for use in general construction and repair projects.
Design Mixes
Grades M30 to M70 are labeled ‘design mix’. This means the concrete designer specifies the concrete mixture ratio based on scientific analysis and experimentation.
A design mix considers the water ratio in cement paste, the unique properties of the materials, and other external factors. Design mixes may also incorporate various admixtures that impact the concrete’s PSI.
When developing a design mix, an engineer will create several batches, experimenting with different ratios to create a concrete mix with the desired PSI strength on the concrete PSI chart.
Experimentation is vital for stronger concrete mixtures because a structural engineer cannot rely on an inconsistent nominal mix ratio when constructing an important structure.
Water Ratio
A design mix considers the water ratio in cement paste, the unique properties of the materials, and other external factors. Design mixes may also incorporate various admixtures that impact the concrete’s PSI.
When developing a design mix, an engineer will create several batches, experimenting with different ratios to create a concrete mix with the desired PSI strength on the concrete PSI chart.
Experimentation is vital for stronger concrete mixtures because a structural engineer cannot rely on an inconsistent nominal mix ratio when constructing an important structure.
Design Mix Importance – Example of Concrete PSI Chart Usage
For example, a bridge requires concrete with a high PSI strength on the concrete PSI chart. If the engineer created M40-grade concrete using a nominal ratio, there would be no way of guaranteeing the concrete’s resistance to compressive strength. This is because the engineer didn’t consider how material properties impact the final mix. Finer aggregates may result in less resistant concrete, which could be dangerous when used to build large-scale structures like bridges.
Creating a design mix requires comprehensive knowledge of concrete properties. This means it is only suited to those who have a lot of expertise. Design mix concrete is typical in larger, more complex structures that will experience heavy loads and extreme wear.
More Read: Concrete Break Machine Models for Efficient Strength Testing.
Compressive Strength (MPa and PSI) on the Concrete PSI Chart
On the far right of the table, you’ll notice the different compressive strengths of the concrete mixtures. The compressive strength indicates the maximum load a concrete mix can handle before it fails.
In the table above, compressive strength is denoted in both MPa (N/mm2) and PSI. MPa stands for Megapascal, and concrete PSI chart stands for Pounds per Square Inch.
As previously stated, MPa and PSI both measure the compressive strength of concrete, MPa being metric and PSI being imperial.
The good news is that you can translate the two easily. One Megapascal is the equivalent of 145 PSI. This means that concrete with a compressive strength resistance of 10MPa will have a PSI of 1450.
What Projects are Different Concrete Mix Ratios Useful For?
We now know that concrete with a higher PSI is more compression-resistant and a Concrete PSI Chart, but how does this apply in the real world?
Nominal concrete mixtures under 3,000 PSI shouldn’t be used for complex load-bearing structures. They are best suited to applications such as:
- Flooring, sidewalks, and driveways
- Repair work
- Temporary structures
Concrete in the range of 3,000-4,000 PSI is well-suited to basic structural components like:
- Columns, beams, slabs, and footers
- Small-scale construction projects
- Slab foundations and footings, especially in situations where heavy loads are expected to be stored or moved, such as RV pads
Design mixtures in the range of 4,000-6,000 on the concrete PSI chart are very strong. As such, an engineer may use them when building:
- Bridges and large-scale buildings
- Warehouses and factories
Higher than 7,000 PSI Concrete
Anything higher than 7,000 PSI concrete is considered ultra-high-strength concrete. These concrete mixtures are used in large-scale load-bearing structures or in situations where contamination is possible. For example:
- Nuclear powerplants
- High-rise buildings
- Bridges and tunnels
How to Test the Compressive Strength of a Concrete Mixture?
Depending on the concrete standards you follow, you may choose to test compressive strength using either a concrete cube or concrete cylinder. Here’s a basic step-by-step guide to testing concrete psi chart and compressive strength.
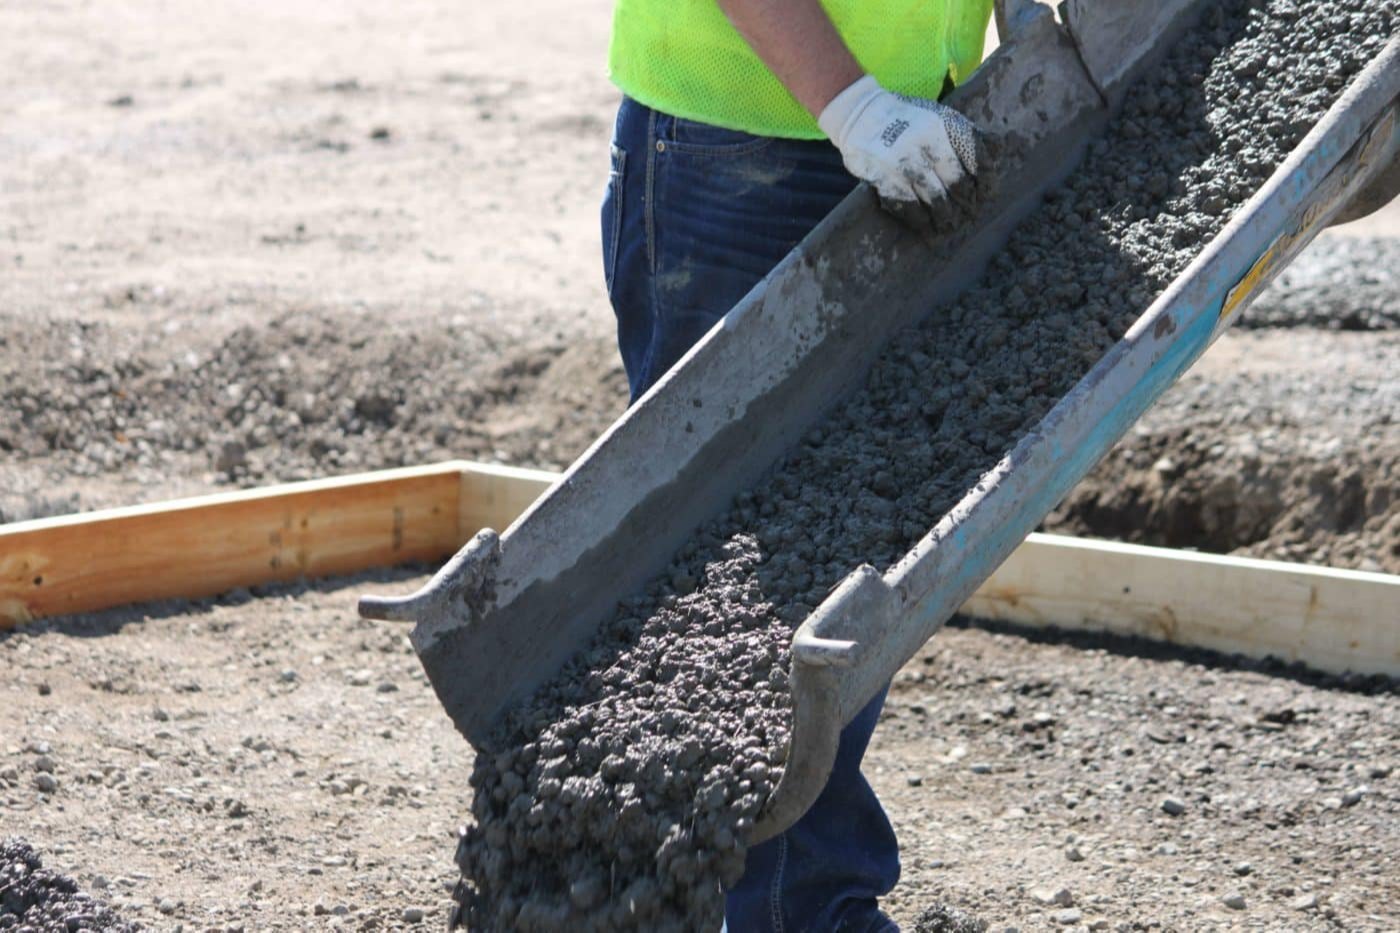
- Prepare the sample: Take a concrete sample from freshly-poured concrete. Pour the sample into your cube or cylinder mold. Use a tamper to remove excess air and compact the concrete.
- Cure the sample: Remove your concrete from the mold after 24 to 48 hours and cure it according to your chosen standard. This typically involves placing the concrete into a moist environment at a specified temperature for a predetermined period (usually 28 days).
- Test the sample: Place the sample in a concrete compressor such as a compressometer or automatic compression testing machine. These machines apply load at a constant rate following recognized standards.
- Find the PSI: Once the sample fails, calculate PSI by dividing the force applied by the cross-sectional area of the specimen. For example, a 2″ concrete cube has a cross-sectional area of 4 square inches. Let’s assume that the concrete withstood a force of 10,0000 pounds. Dividing 10000 by 4 gives us a concrete strength of 2500 PSI.
Where Can I Find the Best Material Testing Equipment?
Knowing how to interpret a concrete PSI chart is one thing. Having the right equipment for your own concrete testing is another. CertifiedMTP is your one-stop shop for all your material testing needs.
We offer a range of compression testing equipment, molds, tampers, finishing trowels, and more, designed to make creating accurate concrete mixtures fast, easy and reliable.
Looking for something different? We also offer a range of soil testing, aggregate testing, asphalt testing, and cement testing equipment. Whatever your material testing needs, CertifiedMTP has the equipment and expertise to help you get things done.
Can’t find what you’re looking for? Get in touch. With thousands of products from some of the world’s leading material testing brands, we’re sure to have what you need.
For more concrete testing needs, consider the popular Mini-Jaw Crusher


